
The Reports tab
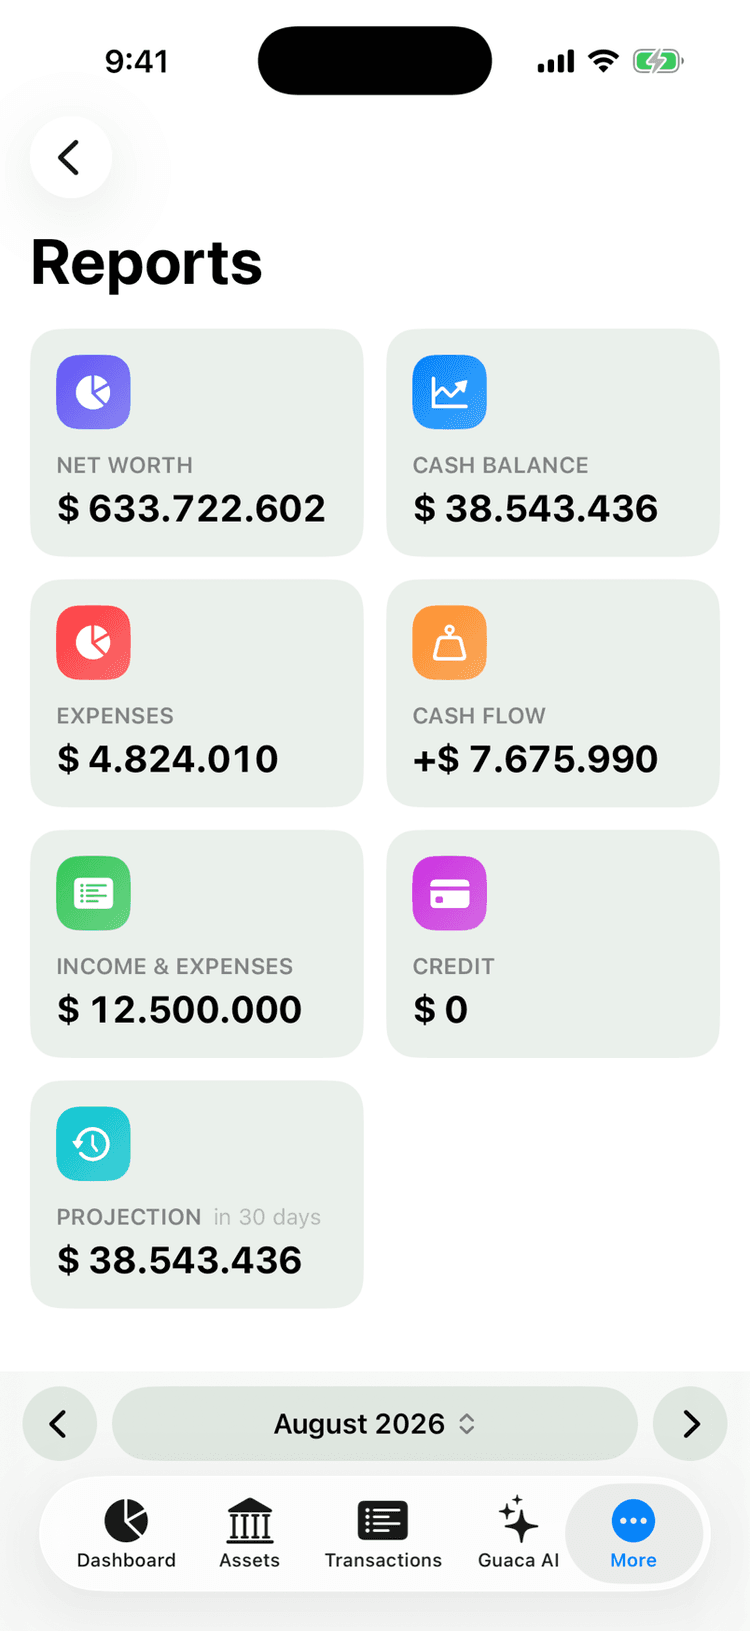
The Reports tab is a hub of cards laid out in a two-column grid. Each card shows a headline number for the selected period, and tapping it opens the full report with its chart and rows.
- Net Worth
- Line chart of your net-worth trend, with Assets / Liabilities and Today figures.
- Cash Balance
- Total Cash Balance over time plus an Accounts list of every active account.
- Income
- Donut of income by category with a Total in the center and Categories rows with share bars.
- Expenses
- The same donut and category rows for what you spent.
- Income vs Expenses
- One unified donut with Net in the center, drilling down the same way.
- Cash Flow
- Bar chart of income against expenses, Net Cash Flow, Total Net and a row per day or month.
- Recurring
- What your recurring rules add up to per month: bills, recurring income and the net.
- Credit
- Total debt, available credit and utilization across your credit cards.
- Projection
- Your Projected Balance in 30 days, with longer horizons a tap away.
- Annual Expenses
- Yearly spending per year: Baseline Total, Year-over-year change and a Colombia CPI reference. A Reports card on Android; on iPhone it lives in the Budget hub under Historical.
Periods, filters and drill-down
A period bar is pinned under the title of the hub and of every report. Tap ‹ or › to move one period back or forward (Previous period / Next period); a custom range shifts by its own span, and the arrows are disabled on All Time.
Tap the center of the bar to pick a unit — Week, Month, Quarter, Year or All Time — or a preset: Last 3 Months, Last 12 Months or Year to Date. Custom Range… asks for a Begin and End date; tap Apply to use it.
Inside Income, Expenses, Income vs Expenses and Cash Flow, the funnel icon opens the Report filters sheet:
- Currencies
- All by default; pick one or more to keep only transactions in those currencies (the row then reads N selected).
- Categories
- Choose the categories to include, with Select All and Deselect All shortcuts. Selecting a parent includes its subcategories.
- Valuation
- The Asset valuation changes toggle counts appreciation or depreciation of gold, vehicles, stocks and crypto as income or expense. Available only when no category or tag filter is set.
- Tags
- Limit the report to transactions carrying the tags you pick.
There is no account filter. Filters reset when you return to the hub, while the period persists.
Every category report drills down to the transactions behind a number:
- 1Tap a donut slice or a Categories row to open that category's subcategories; the parent's own transactions appear in a row named after it with (direct) appended.
- 2Tap a subcategory to list its transactions (N transactions).
- 3Tap a transaction to open it in the edit form.
The Valuation gains/losses slice opens a Valuation Changes list instead. In Cash Flow, tap a bucket's income or expense amount to see that day's or month's category breakdown. Charts respond to touch: drag across a line or the bars to read exact values.
All totals are shown in your display currency, with historical exchange rates applied to ledger amounts. Reports have no export or share option on either platform.
Net worth, cash and projection reports
Net Worth draws a Net Worth Trend line for the selected period and shows Assets / Liabilities next to Today. It is built from daily snapshots where available: Guaca keeps one per day (a same-day snapshot is updated in place), captured on every change or reload on iPhone and after sync passes or pull-to-refresh on Android.
At the bottom, the Back in Time row lets you compare two snapshots to see what moved your net worth. See Time Travel.
Cash Balance charts your Total Cash Balance over time and lists your Accounts underneath. It covers all active accounts, converted at current rates, and excludes pending transactions. Tap an account to open its detail.
Projection estimates your Projected Balance from your recurring rules and income streams. Switch the horizon with the 30D, 90D, 6M and 1Y chips, and check the Upcoming list for the movements behind the estimate. This report has no period bar.
Credit summarizes your credit cards with Total Debt and Available Credit, then shows these rows for each card:
- Utilization
- How much of the card's limit you are currently using.
- Spent This Cycle
- Charges made in the current statement cycle.
- Next Close
- When the current cycle closes.
- Payment Due
- The date the payment is due.
With no cards tracked, the report shows No Credit Cards.
Recurring condenses your recurring rules into a Per Month summary — Bills, Recurring Income and Net — followed by one row per rule with its name and next date. Transfers are excluded, and like Projection it ignores the period bar.
The Dashboard
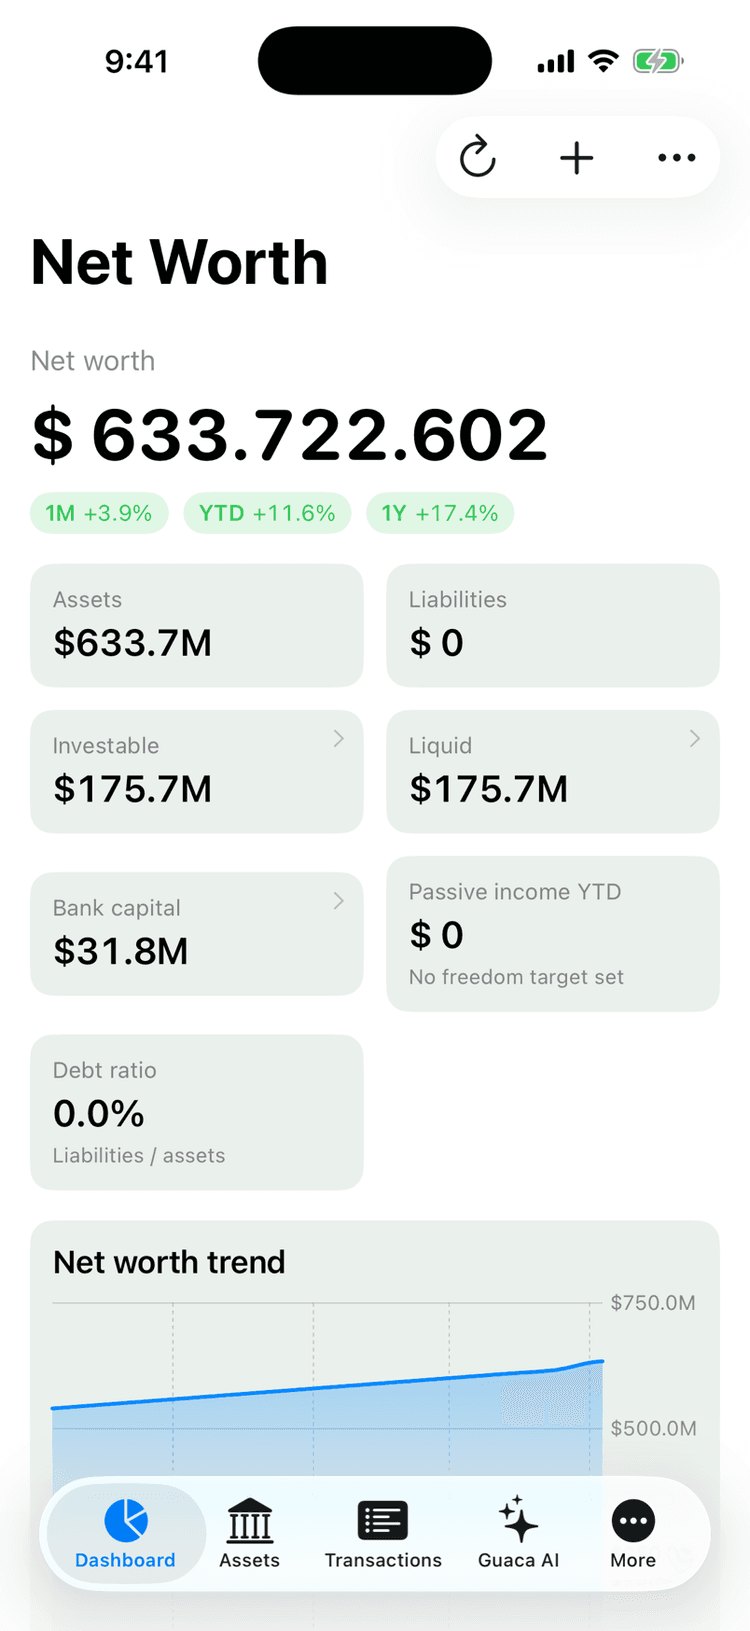
The Dashboard tab is your home screen: a stack of cards that each summarize one part of your finances. You choose which cards appear and in what order (see the next topic). These cards are shown by default:
- Savings goals (Goals on iPhone) — progress on the goals you are saving toward.
- Key stats — Net worth, Assets, Liabilities, Investable, Liquid, Bank capital and Debt ratio; tap Investable, Liquid or Bank capital to see the breakdown.
- Ask Guaca AI — a shortcut to the assistant (see Guaca AI).
- Net worth trend — how your net worth has moved over time.
- Allocation — how your holdings are split.
- Country exposure — where your portfolio is exposed geographically.
- Top spending — your biggest spending categories; tap one to open the filtered transaction list.
- Top holdings — your largest positions.
- Monthly cashflow — income versus expenses month by month.
- Upcoming recurring — the next 30 days of recurring transactions and how many are pending to confirm.
- Budgets — how each budget is tracking.
- Freedom progress — passive income year to date against your annual target.
Cards that summarize a bigger view end with a Show More footer: the trend card opens the Net Worth report, cashflow opens Cash Flow, upcoming opens Recurring, budgets opens Budget and freedom opens Retirement.
On first run a Get started checklist sits at the top: add an account, your first transaction, a retirement plan, additional assets, recurring transactions, a budget, an import, and Sync & Guaca AI. You can dismiss it, and it hides itself once everything is done. Before you add anything the tab shows Nothing tracked yet with an Add First Bank Account button.
The footer shows the current rate (1 USD = X, when your display currency is not USD) and Last snapshot: <date>, the date of the latest net worth snapshot. There is no recent-transactions card; for that, use the Recent Transactions home-screen widget described below.
Customizing the Dashboard
- 1Open the Dashboard tab.
- 2Tap Customize Home (↑↓) in the toolbar, or scroll to the bottom and tap Customize….
The Customize Home sheet lists every card. Tick the checkbox (Android) or flip the toggle (iPhone) to show or hide a card, and drag the ≡ handle to reorder — hidden rows can be dragged too. Reset restores the default arrangement.
Hidden cards stay available in the sheet, and your arrangement syncs across your devices. These extra cards are off until you turn them on:
- Available money — a headline figure for the money you have available.
- To review — movements Guaca found for you to review.
- Monthly snapshot — Came in, Went out, Left over and Savings rate for the month.
- Coming up — your upcoming commitments.
- Net worth headline — your net worth as a single large number.
- Financial freedom — your estimated financial-independence date.
- Debt-free countdown — how long until you are debt-free.
The alerts bell
The bell in the Dashboard title row (Notifications) shows a red badge whenever alerts have arrived since you last opened the history. Tap it to open Alerts, grouped into Today, Yesterday and Unread. Before anything arrives it reads No alerts yet. Alerts you receive will show up here.
Unseen alerts and pending suggestions also surface as an attention strip on the Dashboard, which you can dismiss once you have looked at them.
Home-screen widgets and quick actions
Guaca ships four home-screen widgets so you can check key numbers without opening the app. Tapping any widget opens Guaca.
- Net Worth
- Your net worth and its recent trend. Small, medium and large on iPhone; resizable on Android.
- Daily Movers
- Today's biggest winners and losers across your portfolio.
- Recent Transactions
- The latest transactions across your accounts. Medium and large on iPhone; 4×2 minimum on Android.
- Planned Transactions
- Pending confirmations and upcoming recurring transactions.
- 1Long-press your home screen until the icons jiggle.
- 2Tap Edit, then +.
- 3Search for Guaca, pick a widget and size, and add it.
The app writes widget data when it launches, after each sync and when it goes to the background; widgets also refresh hourly as a fallback. Until you open the app once, iPhone widgets read Open Guaca to load data.
Long-press the Guaca app icon on either platform for quick actions: Add Transaction, Add Account, Import (Import Transactions on iPhone) and Reports (View Reports on iPhone). On iPhone, Guaca also adds these actions to Siri and the Shortcuts app (Android has no equivalent):
- Add Card Transaction and Card Balance.
- Net Worth — ask “What's my net worth in Guaca”.
- Add Expense, Log Transfer and Confirm Pending.
- Month Spending — ask “How much have I spent this month in Guaca”.
- Sync Accounts and Capture Transaction Text.
Behind the trend card and the Net Worth widget is one net worth snapshot per day (the same-day entry is updated in place). On iPhone it is captured on every change or reload; on Android after a sync pass and on pull-to-refresh. Snapshots feed the Net Worth report, the Last snapshot footer and Back in Time.